Every good accounting professional appreciates accounting software and programs that make generating useful reports easy. Having the ability to create reports that indicate the financial wellbeing of business operations in an organized and appealing way leaves everybody happy. This is why Sage 50 is used widely in the industry. Sage 50 has a variety of functions that accounting professionals can use every day. In fact, Sage 50 offers 18 different ready-to-use reports as well as the ability to customize reports to fit any organization’s needs.
Are you interested in pursuing an accounting career? Read on to discover three ways you can take advantage of Sage 50’s different reports.
1. Use the Sage 50 Report Designer to Create Templates
Top computerized accounting programs like the one offered at Academy of Learning Career College teach students how to use Sage 50 Premium Accounting software. During their studies, students use a hands-on approach to learning by working with real simulated source documents. By the end of the course, you will have worked step-by-step through the procedures you’ll need to know to begin your career in accounting. You may even be ready to apply those newly-honed skills to creating useful reports using Sage 50’s Report Designer.
Every business has its own unique goals, objectives, and stylistic preferences. With that in mind, the Report Designer offers an ideal way to create customized reports. You can use the Report Designer to create reports with only the information you need and stylize them to your organization’s branding. This feature is great for repeat monthly or quarterly reports, as it will save you time in the long run by allowing you to use the same custom-made template.
2. Use the Sage 50 Dashboard Report
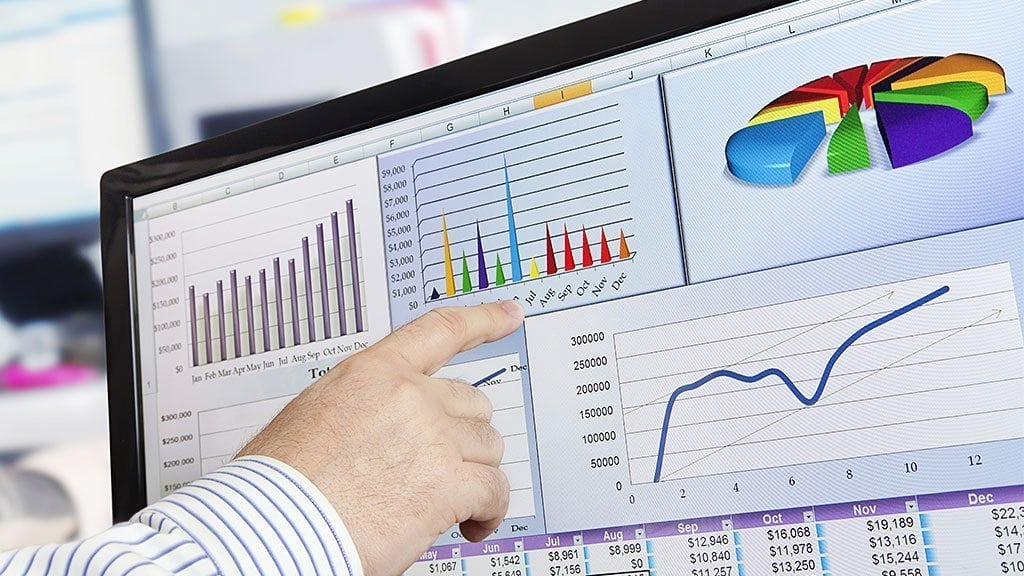
Students who want to begin careers in accounting will soon find generating reports that provide a quick snapshot of a business’s key financial metrics is extremely useful. Using Sage 50’s reports function to generate a Dashboard Report is an easy way to do just that. The Dashboard Report will generate a snapshot of the company’s financial analysis using text and graphic representation. The dashboard delivers accurate, critical, and time-sensitive information in an easy-to-digest way that you can distribute to company management and other decision-makers.

Dashboards provide a quick overview of key company metrics
3. Use the Sales Analysis Report
If you find yourself in a role where you’re asked to generate sales reports, you can use your knowledge of Sage 50 to generate detailed sales analysis reports. Sage 50 has two types of sales reports, the Sales Analysis report and the Top 10 report.
The Sales Analysis report will display item sales quantities, costs, gross profits by the customer, and gross profits by product. It also has a PivotTable function so you can easily drag information in and out if you want to analyze it further.
The Top 10 report, on the other hand, uses graphics and text to show you the top customers and products. You can manipulate the information to display sales by region, sales by the representative, and date range. This can be useful for seeing which customers are buying what and when they are making their purchases, which makes it easier to track inventory and production levels.
Contact an advisor at AOLCC today!